The following patch has been applied to SCons to replace apply() function calls with corresponding python 2 syntax. Usage of apply() makes analysis of the profiling graph very difficult as most of the code path go through apply().
Environment and SConscript are as follow:
SConstruct:
env = Environment(CPPFLAGS=['/Od'], CPPDEFINES=['WIN32'], CPPPATH=[Dir('#')])
env.SConscript("lib_0/SConscript", exports=['env'])
SConscript:
Import('env')
list = Split("""
    class_0.cpp
    class_1.cpp
    #...
    class_99.cpp
    """)
env.StaticLibrary("lib_0", list)
env.StaticLibrary("lib_1", list)
#...
benchgen-help: scons.py --max-drift=5 --implicit-cache -s --debug=time --help
benchgen-full-dry-run: scons.py --max-drift=5 --implicit-cache --debug=time -n
benchgen-clean: scons.py --max-drift=5 --implicit-cache --debug=time -s -c
benchgen-full: scons.py --max-drift=5 --implicit-cache --debug=time -s
benchgen-nothing: scons.py --max-drift=5 --implicit-cache --debug=time -s
benchgen-fullj2: scons.py --max-drift=5 --implicit-cache --debug=time -j2 -s
benchgen-nothingj2: scons.py --max-drift=5 --implicit-cache --debug=time -j2 -s
benchgen-fullj3: scons.py --max-drift=5 --implicit-cache --debug=time -j3 -s
benchgen-nothingj3: scons.py --max-drift=5 --implicit-cache --debug=time -j3 -s
benchgen-full-dry-runj4: scons.py --max-drift=5 --implicit-cache --debug=time -n -j4
benchgen-fullj4: scons.py --max-drift=5 --implicit-cache --debug=time -j4 -s
benchgen-nothingj4: scons.py --max-drift=5 --implicit-cache --debug=time -j4 -s
benchgen-fullj6: scons.py --max-drift=5 --implicit-cache --debug=time -j6 -s
benchgen-nothingj6: scons.py --max-drift=5 --implicit-cache --debug=time -j6 -s
benchgen-fullj12: scons.py --max-drift=5 --implicit-cache --debug=time -j12 -s
benchgen-nothingj12: scons.py --max-drift=5 --implicit-cache --debug=time -j12 -s
Brief description of the experiments:
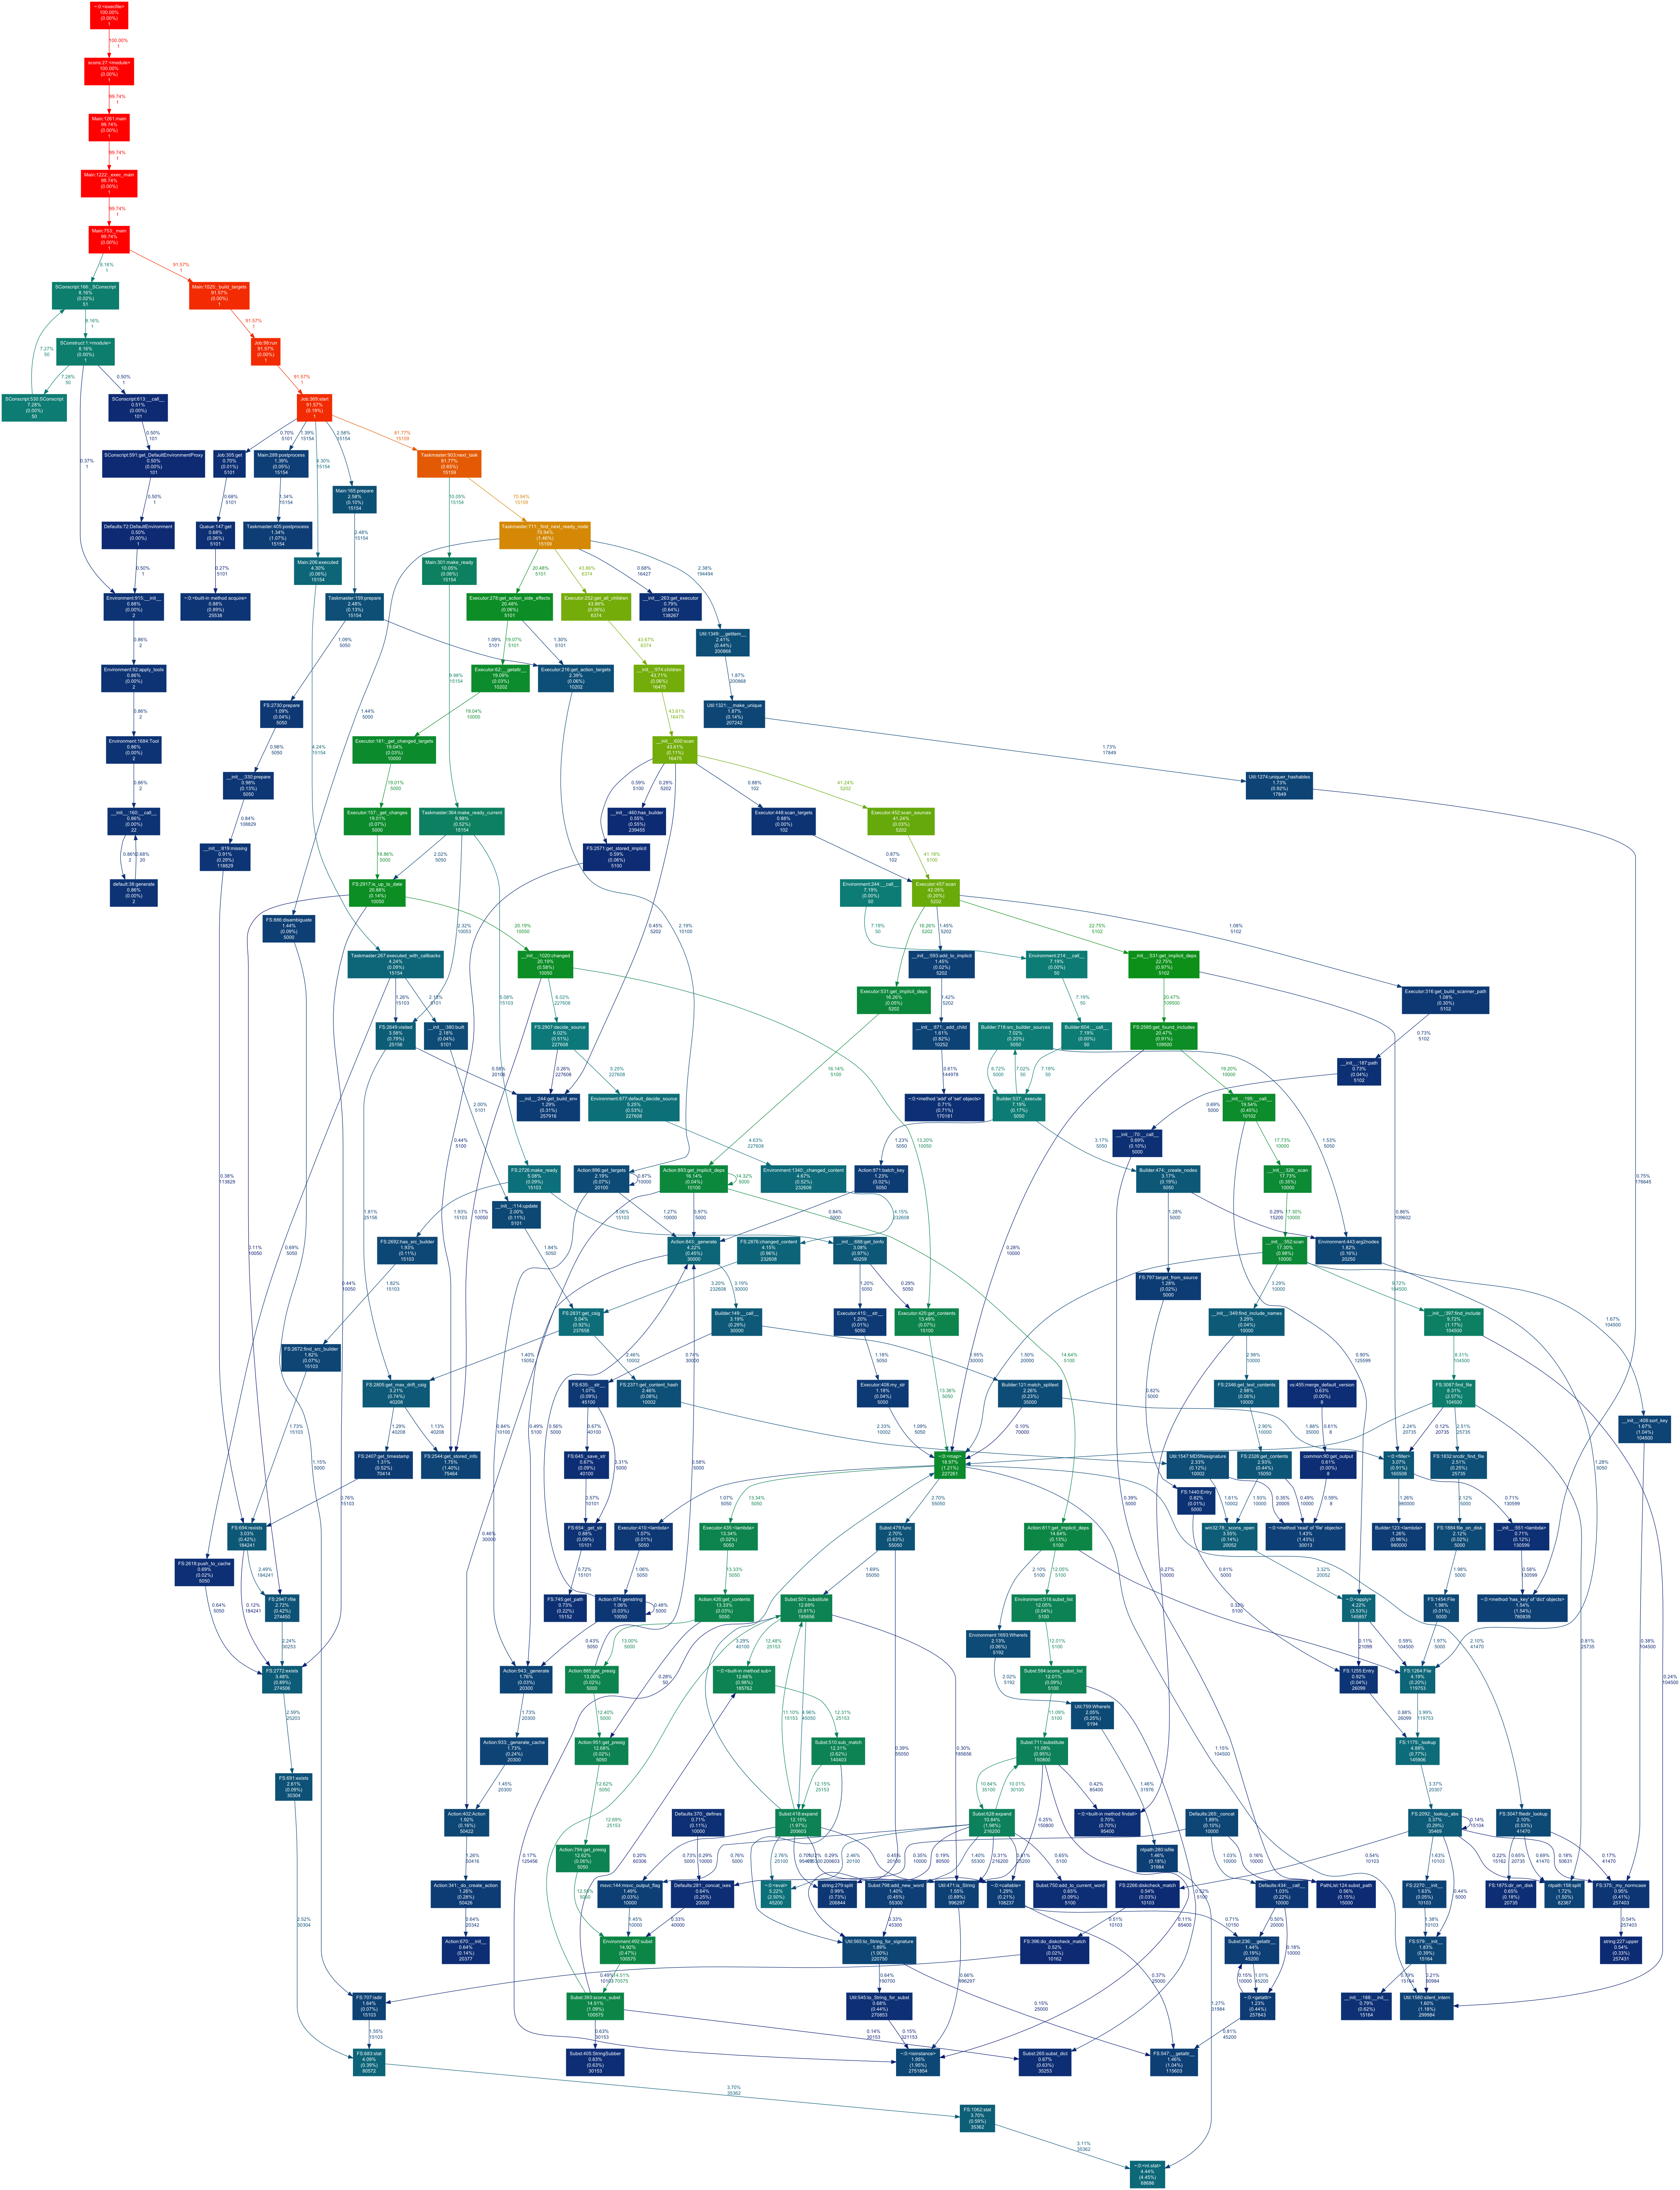
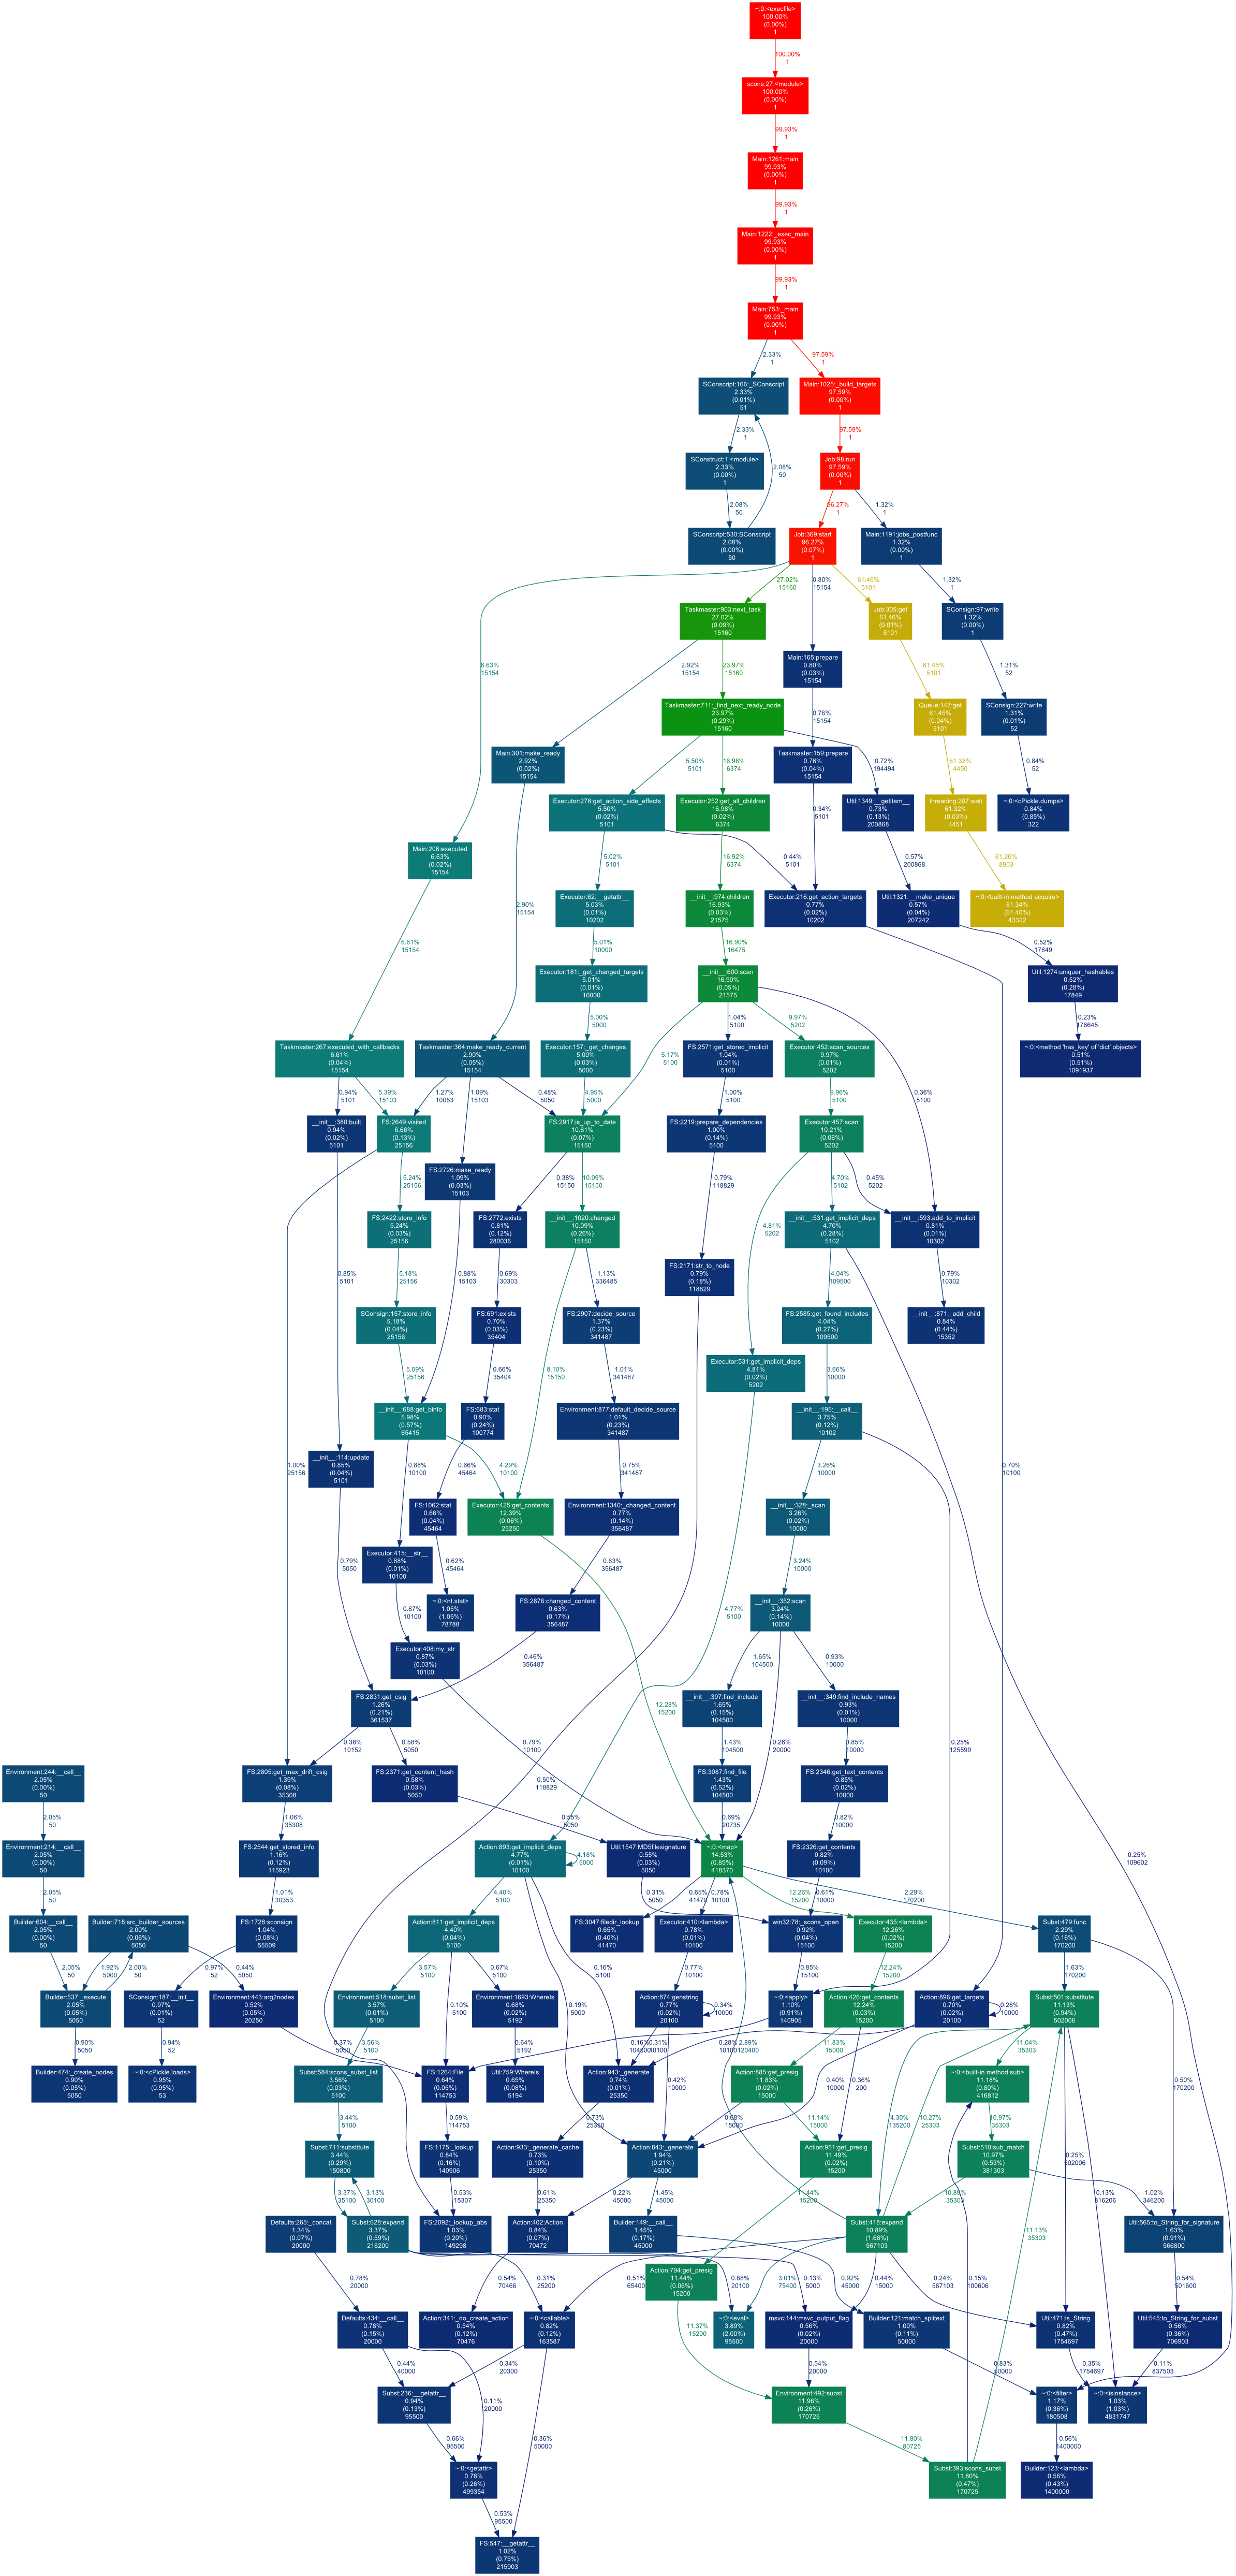
Notes that it is recommanded to use InkScape to view the SVG profiling graph. The PNG pictures are provided for convenience but are huge (10Kx10K pixels, 2Mb). Firefox SVG viewer does not display text in node correctly.
Profile graph are generated using Gprof2Dot and Graphviz dot.
Experiments were run on an Intel Q6300 CPU (this means 4 cores) on Windows XP SP3 (32 bits) with python 2.5.2 and 3Go of RAM.
The following tarball (2.8Mo) contains all the scripts, generated sources and profiling results (with the exception of png images).
Notes: I suspect that python profiler as trouble providing meaningful result in multi-thread (parallel build) profiling result. Parallel build have experiment name ending with -jN) do not reflect reality.
| Group Name | Experiment | Time | Profile graph | |||
| Build | SConscript | SCons | Command | |||
| gfw_svn_200902.1 | benchgen-help | 7.485s | 7.219s | 0.266s | 0.000s | // |
| gfw_svn_200902.2 | benchgen-help | 7.375s | 7.157s | 0.218s | 0.000s | svg/png/dot |
| gfw_svn_200902.3 | benchgen-help | 7.422s | 7.188s | 0.234s | 0.000s | // |
| gfw_svn_200902.1 | benchgen-full-dry-run | 86.000s | 7.219s | 66.102s | 12.679s | // |
| gfw_svn_200902.2 | benchgen-full-dry-run | 84.250s | 7.141s | 64.007s | 13.102s | svg/png/dot |
| gfw_svn_200902.3 | benchgen-full-dry-run | 84.969s | 7.219s | 65.158s | 12.592s | // |
| gfw_svn_200902.1 | benchgen-full-dry-runj4 | 88.891s | 7.172s | 0.266s | 81.453s | // |
| gfw_svn_200902.2 | benchgen-full-dry-runj4 | 88.891s | 7.172s | 0.266s | 81.453s | svg/png/dot |
| gfw_svn_200902.3 | benchgen-full-dry-runj4 | 88.891s | 7.172s | 0.266s | 81.453s | // |
| gfw_svn_200902.1 | benchgen-clean | 63.110s | 7.093s | 56.017s | 0.000s | // |
| gfw_svn_200902.2 | benchgen-clean | 62.953s | 7.141s | 55.812s | 0.000s | svg/png/dot |
| gfw_svn_200902.3 | benchgen-clean | 63.485s | 7.172s | 56.313s | 0.000s | // |
| gfw_svn_200902.1 | benchgen-full | 802.047s | 7.156s | 85.885s | 709.006s | // |
| gfw_svn_200902.2 | benchgen-full | 804.735s | 7.157s | 86.008s | 711.570s | svg/png/dot |
| gfw_svn_200902.3 | benchgen-full | 796.610s | 7.156s | 85.904s | 703.550s | // |
| gfw_svn_200902.1 | benchgen-fullj2 | 428.219s | 7.235s | 3.859s | 417.125s | // |
| gfw_svn_200902.2 | benchgen-fullj2 | 426.672s | 7.718s | 3.813s | 415.141s | svg/png/dot |
| gfw_svn_200902.3 | benchgen-fullj2 | 424.766s | 7.375s | 3.813s | 413.578s | // |
| gfw_svn_200902.1 | benchgen-fullj3 | 299.250s | 7.063s | 4.296s | 287.891s | // |
| gfw_svn_200902.2 | benchgen-fullj3 | 306.297s | 7.140s | 4.329s | 294.828s | svg/png/dot |
| gfw_svn_200902.3 | benchgen-fullj3 | 300.406s | 7.125s | 4.281s | 289.000s | // |
| gfw_svn_200902.1 | benchgen-fullj4 | 250.141s | 7.141s | 3.813s | 239.187s | // |
| gfw_svn_200902.2 | benchgen-fullj4 | 250.141s | 7.141s | 3.813s | 239.187s | svg/png/dot |
| gfw_svn_200902.3 | benchgen-fullj4 | 250.141s | 7.141s | 3.813s | 239.187s | // |
| gfw_svn_200902.1 | benchgen-fullj6 | 246.469s | 7.047s | 4.281s | 235.141s | // |
| gfw_svn_200902.2 | benchgen-fullj6 | 252.860s | 7.109s | 4.407s | 241.344s | svg/png/dot |
| gfw_svn_200902.3 | benchgen-fullj6 | 249.484s | 7.156s | 4.328s | 238.000s | // |
| gfw_svn_200902.2 | benchgen-fullj12 | 258.906s | 7.140s | 4.328s | 247.438s | svg/png/dot |
| gfw_svn_200902.3 | benchgen-fullj12 | 254.922s | 7.125s | 4.312s | 243.485s | // |
| gfw_svn_200902.1 | benchgen-nothing | 47.000s | 7.141s | 39.859s | 0.000s | // |
| gfw_svn_200902.2 | benchgen-nothing | 47.782s | 7.281s | 40.501s | 0.000s | svg/png/dot |
| gfw_svn_200902.3 | benchgen-nothing | 47.468s | 7.235s | 40.233s | 0.000s | // |
| gfw_svn_200902.1 | benchgen-nothingj2 | 47.531s | 7.172s | 40.359s | 0.000s | // |
| gfw_svn_200902.2 | benchgen-nothingj2 | 47.531s | 7.172s | 40.359s | 0.000s | svg/png/dot |
| gfw_svn_200902.3 | benchgen-nothingj2 | 47.531s | 7.172s | 40.359s | 0.000s | // |
| gfw_svn_200902.1 | benchgen-nothingj3 | 46.750s | 7.079s | 39.671s | 0.000s | // |
| gfw_svn_200902.2 | benchgen-nothingj3 | 47.515s | 7.172s | 40.343s | 0.000s | svg/png/dot |
| gfw_svn_200902.3 | benchgen-nothingj3 | 47.594s | 7.203s | 40.391s | 0.000s | // |
| gfw_svn_200902.1 | benchgen-nothingj4 | 47.484s | 7.188s | 40.296s | 0.000s | // |
| gfw_svn_200902.2 | benchgen-nothingj4 | 47.484s | 7.188s | 40.296s | 0.000s | svg/png/dot |
| gfw_svn_200902.3 | benchgen-nothingj4 | 47.484s | 7.188s | 40.296s | 0.000s | // |
| gfw_svn_200902.1 | benchgen-nothingj6 | 46.797s | 7.094s | 39.703s | 0.000s | // |
| gfw_svn_200902.2 | benchgen-nothingj6 | 48.843s | 7.719s | 41.124s | 0.000s | svg/png/dot |
| gfw_svn_200902.3 | benchgen-nothingj6 | 47.203s | 7.171s | 40.032s | 0.000s | // |
| gfw_svn_200902.2 | benchgen-nothingj12 | 47.625s | 7.203s | 40.422s | 0.000s | svg/png/dot |
| gfw_svn_200902.3 | benchgen-nothingj12 | 47.484s | 7.406s | 40.078s | 0.000s | // |
Notes: there is no result for gfw_svn_200902.1/benchgen-fullj12 because python/SCons crashed on a NULL pointer access during the execution. As a consequence the gfw_svn_200902.1/benchgen-nothingj12 experiment has been removed as it was no longer a "do nothing" build.